
Published November 19, 2021
Doctoral School of Economics, Business and Informatics, Corvinus University Budapest
Remarks presented at 17th Annual Conference, Doctoral School of Economics, Business and Informatics,
Corvinus University Budapest, 19 November 2021
(Click here to view the slides that accompany this text in PDF format)
(Click here to view a full-text PDF of the paper that is the subject of these remarks)
The AAA Index (or Index of Human Flourishing) is a new country index, named after the ancient and medieval scholastic philosophers, Aristotle, Aurelius Augustine and Thomas Aquinas, which seeks to measure how well individual countries promote human flourishing as “rational,” “conjugal,” “money-making,” “social,” “political” and “spiritual animals.”
I began working on the AAA Index about five years ago, when I was in Budapest for publication of the Hungarian translation of Redeeming Economics: Rediscovering the Missing Element. In that book I demonstrated that, far from founding economics, as some wrongly supposed, Adam Smith had oversimplified the existing scholastic economic theory, by subtracting two of its four basic elements or equations, which Thomas Aquinas had synthesized from Aristotle and Augustine’s writings. Beginning a century after Smith, around 1870, today’s so-called “neoclassical” economics restored one missing element, Augustine’s theory of utility, but not the other, final distribution, which describes our interpersonal relations of love (which is expressed by personal or collective gifts) or hate (which is expressed by the opposite of a gift, crime).
My paper contains several examples regarding Brazil, because a new Portuguese translation was being published in Brazil, and when the editor requested a new preface, I suggested instead a new Afterword, describing the AAA Index and applying its lessons for Brazil (which has the world’s fifth-largest population and is the world leader in renewable energy).
While in Budapest, I began working with a team of Hungarian researchers led by Zoltan Szanto, who were establishing the Social Futuring Center (SFC) at Corvinus University. Assisted by the Hungarian Statistical Office, the SFC eventually published the polished, 28-variable Social Futuring Index (SFI) and calculated the SFI for the 36 member countries of the OECD, which comprise about 16 percent of world population and produce about 50 percent of world real GDP.
I constructed the AAA Index because I thought it worthwhile to publish also a much simpler index (with only nine variables), more directly inspired by scholastic moral philosophy, which, besides the OECD, could be applied also to the 10 most populous countries in the world, ranging from China to Mexico, thus comprising about two-thirds of world population and producing about 80 percent of world real GDP.
The AAA Index differs from existing country indices in at least three ways: First, the AAA Index avoids the many technical problems endemic to what Martin Ravallion has called “mashup indices,” by being based on the coherent, longstanding scholastic philosophy and economic theory. It seems to me that the more widely modern society diverges from the scholastic view of man as a “rational,” “conjugal,” “money-making,”[1] “civic,” “religious,” and “political animal,” the more resoundingly is the scholastic view of human nature vindicated by the results of modern social science (which historically originated in the medieval “schools” or universities).[2]
Second, while avoiding the redundancy which results from including existing market indices like GDP, the AAA Index usefully combines three databases: First, the Maddison Project database, named after the Scottish economist Angus Maddison, who calculated the population and real GDP per capita for most countries back to AD 1; Second, the Barro-Lee database on educational attainment, starting in 1820 and projected forward to 2040; and Third, the UN Population Division database, which estimates population for all countries from 1950 forward to 2100. Finally, with such techniques as analyzing microdata for all waves of the World Values Survey (WVS), the AAA Index illuminates the world-wide behavioral changes which have resulted from the decline in religious practice: reduced fertility, reduced altruism and a reduction in self-assessed happiness.
One chart from the Maddison Project database compares life expectancy at birth with the logarithm of real GDP per capita over a period of more than 2,000 years. It indicates that rises in longevity have been associated with corresponding increases in the log of real income per capita—presumably because a longer life increases the rates of return on all kinds of long-term investments in both intangible and tangible forms of both human and nonhuman capital. (Human population is a form of ‘tangible human capital’; education is an example of ‘intangible human capital.’ Buildings and machines are examples of ‘tangible nonhuman capital’; patents are examples of ‘intangible nonhuman capital.’)
The Barro-Lee database contains many variables describing primary, secondary and tertiary education for more than 100 countries, and it was not obvious a priori which if any variables are important, without analyzing their empirical relation to other variables. My attitude that “less is more”—that is, simpler models are usually more informative than more complicated models–was reinforced when I discovered that a single variable from the Barro-Lee database—the share of adult population with some tertiary education—accounts for most of the variation among countries in real GDP per capita, while none of the other Barro-Lee variables was statistically significant for this purpose.
The UN Population Division database provides many demographic variables, but the Net Reproduction Rate (NRR: the average number of surviving daughters born to each woman) seems the most useful, since it amounts to a prediction of the multiple by which a country’s population will change over the next generation. The AAA Index constructs the Net Marital Reproduction Rate by adding an OECD series on whether children are born within wedlock. The AAA Index beyond mere tabulation, also implies several normative claims—for example, that it is better for parents, children and the rest of society if each child is born and raised in an intact marriage of its biological parents.
By combining the share of population with tertiary education from the Barro-Lee database with the Net Reproduction Rate from the UN data, the AAA Index can be used to project real GDP about two to three decades ahead.
Based on the UN projections, in the rest of the 21st century, the NRR in nearly all countries will converge on a value below 1.00, indicating that world total population will be declining.
Why is this? Though the UN Population Division does not seem to recognize the link, the most important single reason appears to be the decline in religious practice, which explains about half the variation in fertility rates for those countries for which data are available. On average in all the countries surveyed by the World Values Survey, those couples which worship at least weekly have about one child more than couples which never worship. Moreover, the same couples who worship at least weekly report themselves happier than those which never worship, roughly in proportion to their frequency of worship.
Something similar appears in the WVS data on altruism, as measured by unpaid volunteer work: Those who worship at least weekly perform the most unpaid volunteer work, not only in their own churches (which perhaps is not surprising) but also in non-religious charities serving youth, recreational, cultural activities and the disadvantaged. They also report greater happiness than those who never worship, again roughly in proportion to their frequency of worship.
Among the ten countries with the largest populations, Nigeria ranks first in the AAA Index, followed by Indonesia and Brazil. But the AAA Index is calculated in two ways regarding total and renewable energy independence (in which case Brazil ranks first, Indonesia second, and India third, with the USA eighth and China last).
Among all 39 countries for which the AAA Index can be calculated, however, comprising about two-thirds of world population and producing 80 percent of world real GDP, the top ten countries in order are Norway, Nigeria, Indonesia, Australia, Brazil, India, Canada, Mexico, Switzerland, and New Zealand. The USA ranks 28th and China 39th (last). But the USA and China each has a feature largely peculiar to itself: China ranks zero in voting by IDEA because of its communist government, and the USA is the only major country with negative monetary reserves—having more foreign official liabilities than assets—due to the dollar’s use as official reserve currency.
OECD + 10 Most Populous Countries, Ranked by Share of World Population, GNI/capita and AAAI
| Rank | Country | Popu-lation /World | Rank | WB code | GNI/ Capita $Int | Rank | WB Code | AAAI (NRR) | AAAIM (marital NRR) |
| 1 | China | 0.1794 | 1 | LUX | $74,400 | 1 | NOR | 0.2856 | 0.1299 |
| 2 | India | 0.175 | 2 | NOR | $70,530 | 2 | NGA | 0.2417 | na |
| 3 | United States | 0.0422 | 3 | CHE | $82,180 | 3 | IDN | 0.1985 | na |
| 4 | Indonesia | 0.0345 | 4 | IRL | $67,050 | 4 | AUS | 0.1634 | 0.108 |
| 5 | Pakistan | 0.0286 | 5 | USA | $63,780 | 5 | BRA | 0.1462 | na |
| 6 | Brazil | 0.0271 | 6 | NLD | $56,890 | 6 | IND | 0.1071 | na |
| 7 | Nigeria | 0.0269 | 7 | DNK | $56,410 | 7 | CAN | 0.1024 | 0.0682 |
| 8 | Bangladesh | 0.0217 | 8 | AUT | $55,300 | 8 | MEX | 0.0992 | 0.0312 |
| 9 | Russia | 0.0186 | 9 | ISL | $55,190 | 9 | CHE | 0.0978 | 0.0789 |
| 10 | Mexico | 0.016 | 10 | DEU | $54,560 | 10 | NZL | 0.0957 | 0.0508 |
| 11 | Japan | 0.0159 | 11 | SWE | $54,030 | 11 | KOR | 0.0953 | 0.0933 |
| 12 | Turkey | 0.0106 | 12 | BEL | $51,740 | 12 | RUS | 0.0921 | na |
| 13 | Germany | 0.0106 | 13 | AUS | $50,050 | 13 | BGD | 0.0897 | na |
| 14 | France | 0.0086 | 14 | FIN | $48,580 | 14 | POL | 0.0891 | 0.0793 |
| 15 | United Kingdom | 0.0085 | 15 | CAN | $47,590 | 15 | NLD | 0.0852 | 0.0455 |
| 16 | Italy | 0.0075 | 16 | FRA | $46,360 | 16 | TUR | 0.0843 | 0.0818 |
| 17 | South Korea | 0.0066 | 17 | GBR | $45,350 | 17 | HUN | 0.0839 | 0.0497 |
| 18 | Spain | 0.006 | 18 | JPM | $45,180 | 18 | ISL | 0.0839 | 0.0497 |
| 19 | Canada | 0.0049 | 19 | KOR | $40,090 | 19 | SWE | 0.0839 | 0.0373 |
| 20 | Poland | 0.0049 | 20 | ISR | $39,940 | 20 | CZE | 0.0819 | 0.0691 |
| 21 | Australia | 0.0033 | 21 | ESP | $39,800 | 21 | DEU | 0.0816 | 0.0526 |
| 22 | Chile | 0.0025 | 22 | NZL | $39,410 | 22 | ISR | na | 0.0724 |
| 23 | Netherlands | 0.0022 | 23 | CZE | $37,530 | 23 | GRC | 0.0786 | 0.0712 |
| 24 | Belgium | 0.0015 | 24 | SLV | $37,450 | 24 | CHL | 0.0774 | 0.0211 |
| 25 | Greece | 0.0014 | 25 | EST | $34,970 | 25 | SVN | 0.0773 | 0.0334 |
| 26 | Czech Republic | 0.0014 | 26 | LTU | $34,320 | 26 | ITA | 0.0764 | 0.0647 |
| 27 | Sweden | 0.0013 | 27 | SVK | $33,060 | 27 | FIN | 0.0752 | 0.0448 |
| 28 | Portugal | 0.0013 | 28 | PRT | $32,680 | 28 | USA | 0.0748 | 0.045 |
| 29 | Hungary | 0.0012 | 29 | POL | $30,010 | 29 | PAK | 0.0742 | na |
| 30 | Israel | 0.0012 | 30 | HUN | $29,860 | 30 | IRL | 0.0725 | 0.0483 |
| 31 | Austria | 0.0011 | 31 | LTV | $29,780 | 31 | FRA | 0.0704 | 0.0349 |
| 32 | Switzerland | 0.0011 | 29 | GRC | $29,670 | 32 | SVK | 0.0702 | 0.0583 |
| 33 | Denmark | 0.0007 | 30 | TUR | $27,640 | 33 | JPN | 0.0636 | 0.0622 |
| 34 | Finland | 0.0007 | 31 | RUS | $26,470 | 34 | PRT | 0.0625 | 0.0433 |
| 35 | Slovakia | 0.0007 | 32 | BRA | $24,450 | 35 | ESP | 0.0588 | 0.0531 |
| 36 | Norway | 0.0007 | 33 | CHL | $24,190 | 36 | LTU | 0.0524 | 0.0438 |
| 37 | New Zealand | 0.0007 | 34 | MEX | $19,340 | 37 | EST | 0.0521 | 0.021 |
| 38 | Ireland | 0.0006 | 35 | CHN | $17,200 | 38 | LVA | 0.0372 | 0.0249 |
| 39 | Lithuania | 0.0004 | 36 | IDN | $12,670 | 39 | CHN | 0.0259 | na |
| 40 | Slovenia | 0.0003 | 37 | IND | $7,680 | Omitted (missing data)/WLD pop. | |||
| 41 | Latvia | 0.0002 | 38 | PAK | $5,860 | 0.11% | AUT | na | na |
| 42 | Estonia | 0.0002 | 39 | NGA | $5,710 | 0.14% | BEL | na | na |
| 43 | Luxembourg | 0.0001 | 40 | BGD | $4,964 | 0.07% | DNK | na | na |
| 44 | Iceland | 0.0001 | 41 | PAK | $4,898 | 0.01% | LUX | na | na |
| – | OECD | 0.1664 | GDP/ WLD | OECD | 0.4953 | 0.85% | GBR | na | na |
| – | OECD + Top 10* | 0.6787 | OECD + Top 10 | 0.8078 | 1.19% | Total | – | – |
The AAA Index
Remarks on John D. Mueller’s paper[3]
[by Tamas Halm, Pazmany Peter University]
John D. Mueller’s response is shown in red
“Bold, interesting and thought provoking”: these words decorate – among many other appreciations – the back cover of John Mueller’s magnum opus: Redeeming Economics. One could not find better adjectives to describe John’s current paper that is also an afterword to the very recent Portuguese translation of the above-mentioned book. (This fact explains why the closing part of the paper contains some specific references to the case of Brazil.)
Both the concept of the AAA index and its elaboration deserve our highest respect, and one must state at the outset that John’s paper exceeds by far the usual level of academic works expected from doctoral students. (We cannot help mentioning that such a great volume, as Redeeming Economics, could have easily earned its author a “doctor of the Hungarian Academy of Sciences” title, let alone a PhD…)
This paper gives us a brief description of the AAA index, and sheds light on the philosophical and moral background of its composition. One must welcome the very broad scope of various indicators that add up to the comprehensive AAA index. John rightly takes into consideration the many facets of human existence when trying to gauge the national measures of human flourishing.
And here we stop and ask the question: what does “flourishing” exactly mean? One must acknowledge that it is a very well-chosen world, since the “variable” that John intends to measure is not human health, wealth, might, freedom, or happiness – but a well-calibrated mixture of all these components.
By applying this index one can rank the nations of the world, and it is an achievement itself. But country-rankings abound – we, economists, are well aware of a lot of them and find great delight in referring to them in our discussions. (Naturally, we tend to always cite those rankings and those places that seem to support are actual arguments…) But besides its descriptive character, John’s index also has a predictive power, and this lends it a certain value-added for several macro policies ranging from agriculture to education, from social welfare to energy. (Just a side remark: this part of the index could not be timelier than now, after COP26.) It is noteworthy that why the paper – rightly – emphasises the importance of non-economic (and even non-material) components of human flourishing, the index is put to practical use in forecasting the long-term development of GDP…
I am very grateful for Tamas Halm’s comments on my paper, which are characteristically thoughtful and generous.
Having appreciated some of the merits of John’s paper, the reviewer must also indulge in some critical comments – most of which will be formulated as questions.
Before posing our questions, however, it must be stated that we would deem not only impolite but also unfair to wonder why the author has chosen the type of indicators he has – and why he has “omitted” others that would have reflected better the reviewer’s preferences. Thus, we try, as much as we can, to remain in the author’s frame of reference.
1. It is natural that education leads the list of indicators since “flourishing” must by all means contain a kind of enrichment – both mental and economic. But tertiary education covers in most cases less (and in many cases much less) than half of the population. Wishing to measure flourishing, would not be it better to rely on data of primary (and perhaps secondary) education?
My initial choice for this variable was far more modest: the share of adult population which is literate. But I settled on the share of adult population with some tertiary education after much statistical analysis. Adult literacy approximates 100% in most countries, changes very little from year to year, and shows little correlation with other variables of interest, e.g. real GDP per capita. The Barro-Lee database contains many variables describing primary, secondary and tertiary education for more than 100 countries, and it was not obvious a priori which if any variables are important, without first analyzing their empirical relation to other variables of interest. My attitude that “less is more”—that is, simpler models are usually more informative than more complicated models—was reinforced when I discovered that a single variable from the Barro-Lee database—the share of adult population with some tertiary education—accounts for most of the variation among countries in real GDP per capita, while none of the other Barro-Lee variables including secondary education was statistically significant for this purpose.
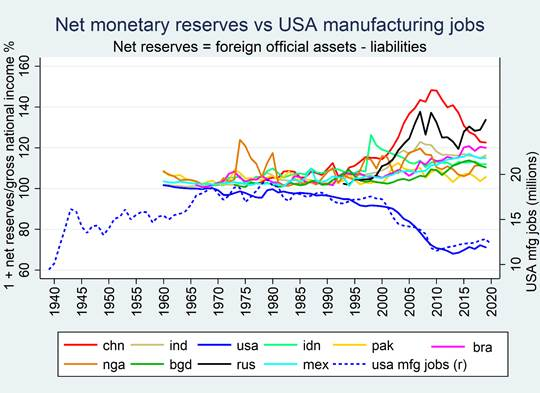
2. As an economist, the reviewer has the gravest question concerning the “business” component. We understand the author’s aversion vis-à-vis the GDP (just think of the famous “Beyond the GDP” project[4] of a good decade ago), but the value of net monetary reserves of a country (relative to its GNI) does not seem to be in close relationship with its flourishing. Apart from some extreme situations, these reserves are typically being kept, and not spent. Perhaps they serve here as an indicator of the “wealth of the nations”, but the reserves are only a miniscule part of the wealth as we understand it in current times. We can read on page 4: “The third indicator is the share of national resources devoted to international monetary reserves which facilitate exchange of products among different countries.” It is true that reserves may facilitate foreign trade, but in practice, imports are covered by exports and negative balances will usually be financed by loans, not by reserves.
Regarding whether this variable adequately represents “business,” I agree that there is a problem. It is difficult to translate the Greek word chrematikos both concisely and accurately with a single English word. The concept refers to the acquisition of wealth that can be measured in money. I think “money-making” probably comes closer than “business” (though it is also clumsier) and the measure of monetary reserves in the AAA Index seems the most useful in applying a single useful indicator to all countries.
I did not mention the monetary reserve variable in my initial remarks in order to focus on other variables. But if we observe this variable for the ten most populous countries, we find that such reserves are far from minuscule for most countries. Moreover, for the United States this variable has had a very high correlation (more than 90 percent) with variation in the level of manufacturing employment[5]—which indicates to me that the U.S. dollar’s role as chief official reserve currency has been an exorbitant burden rather than an “exorbitant privilege” for the USA.
3. Concerning the 4th indicator („civic”), one must bear in mind that participation in civil society organisations may differ a lot across countries, and not just because of different levels of flourishing. In more traditional societies where the fabric of familial ties is more closely knit, these organisations may play a much lesser role. And here we would like to mention our other great concern: The ambition of John’s paper is the almost universal application of his AAA index. Our polite question would be here the following: Would it not be better to focus the use of the index for individual group of countries, e.g. the Western World, Africa, or South East Asia? Furthermore, we are all very well aware of the unfortunate fact that even in some countries of the “Western civilisation”, civil society organisations may sometimes be harassed, trumped down or even persecuted by governments…
I will grant that distinctions must be made depending on what we actually find. But the usefulness of the “natural law” seems to exist in its assumption that there is in fact a single “human nature” regardless of cultural differences. I believe that this both justifies and requires applying the same index impartially to all countries.
4. Going back to our personal field of expertise: As an economist majored in international trade, we would like to mention that the across-the-border exchange of goods is a positive phenomenon. In the “Animal” category of John’s table both in the cases of foods and energy, import is treated – if we understood it well – a kind of regrettable necessity. We think that even countries less endowed e.g. with energy resources could and can flourish quite well…
My treatment of self-sufficiency in water, food and energy as prerequisites for true national self-determination is heavily influenced by Thomas Aquinas’ similar conclusions in his monograph “De regno: On Kingship, to the King of Cyprus.”[6] Aquinas weighs the advantages (greater wealth) and disadvantages (influence by foreign interests and reduced social cohesion) of international trade, but sensibly opposes autarky, which would forego all advantages, as impractical.
5. Our last critical remark refers to the political component of the index. John rightly states that political participation as expressed in voter turnout changed in the formerly socialist countries of Eastern and Central Europe after their transformation into “Western-type” democracies. However, if our memory does not deceit us, the turnout was much higher in those old days before the transition, since participation in the elections was then highly recommended. (And the word “recommended” is an outright understatement here.) We also all know that voter turnout has increased in the United States in the 21st century, and it was especially high in the 2020 presidential election. Apologies for our very last question: Is the American nation flourishing now better?
This is a fair criticism, but seems inherent in representative government, and is not improved by non-representative government. I think the main normative claim of this feature of the AAA Index is that representative government is superior to non-representative government, not that representative government has no flaws—which are certainly evident today in the United States. As Churchill is supposed to have said, it’s the worst form of government except for all the rest.
[1] It is difficult to translate the Greek chrematikos both concisely and accurately with a single English word. The concept refers to the acquisition of wealth that can be measured in money.
[2]Aquinas, T.(1982]) On Kingship: To the King of Cyprus (Tr.) Gerald B. Phelan, (Toronto: Pontifical Institute of Medieval Studies, https://isidore.co/aquinas/DeRegno.htm (Original work published 1260-65.) Aquinas argued “men form a group for the purpose of living well together, and good life is virtuous life…. [Yet] it is not the ultimate end … to live virtuously, but through virtuous living to attain to the possession of God.”
[3] Presented at the 17th Annual Conference, Doctoral School of Economics, Business and Informatics, Corvinus University Budapest, 19 November 2021.
[4] Stiglitz, J.E., A. Sen and J.-P. Fitoussi (2009), Report by the Commission on the Measurement of Economic and Social Progress, http://ec.europa.eu/eurostat/documents/118025/118123/Fitoussi+Commission+report.
[5] [Mueller footnote: I used this chart to accompany a recent article in the New York Sun on the EPPC website: https://eppc.org/publication/time-to-reverse-the-curse-over-the-dollar/]
[6]https://aquinas.cc/la/en/~DeRegno
John D. Mueller is the Lehrman Institute Fellow in Economics and Director of the Economics and Ethics Program at the Ethics and Public Policy Center. Mr. Mueller specializes in the relation of modern economic theory to its Judeo-Christian and Greco-Roman origins, its practical application to personal, family, and political economy, and the interaction of economics, philosophical worldviews, and religious faith. He is also an adjunct senior research fellow at the Social Futuring Center.